Also check out below articles
 13-06-2026
Why Cloudflare Isn't Always the Best Choice
As a website owner you naturally want just one thing: a website that’s always28-04-2026What is the click-through rate, and how can it be improved?
There are a number of situations where click-through rate (CTR) plays a role30-10-2021Create reports about your website
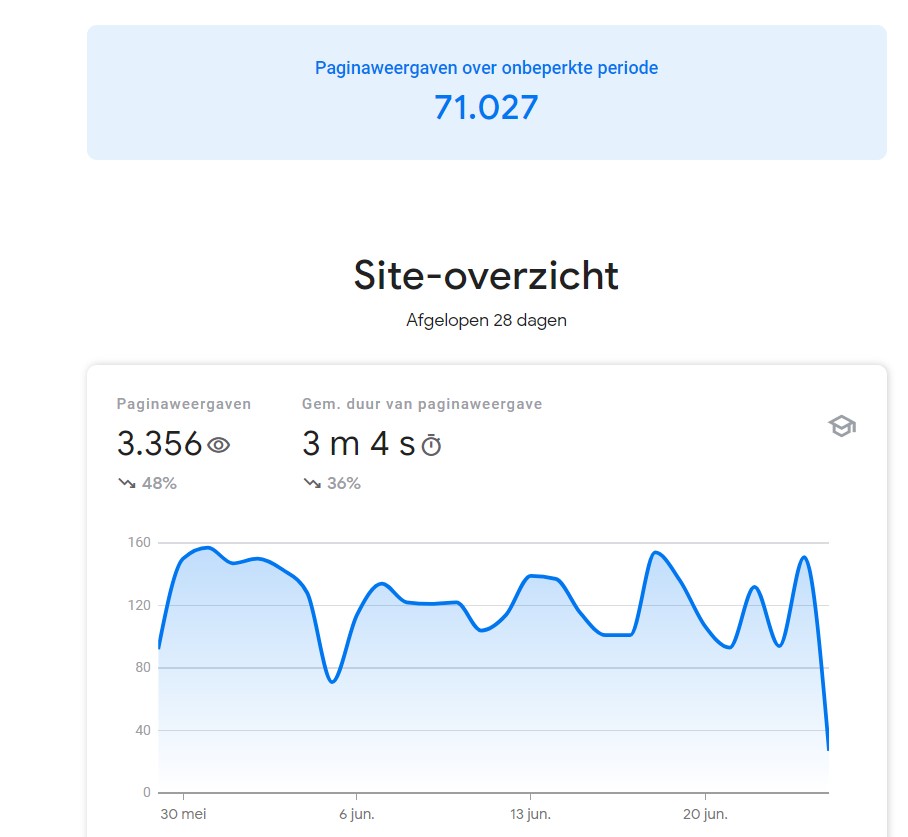
It's that time of year again, when the new year is slowly but surely approaching. With the holiday season approaching and the holidays that come with it, it's probably wise to start creating your reports now. Reports can be created for yourself, for your team, for your supervisor, or for your client. However, it's useful to look at where you are, how things have been in the past, and how you plan to approach the next year. Reports can help you get an overview and see how you are performing. Let's see what kind of reports you can create!
Website reports can be created for many different reasons. Whether you want to report on the number of visitors, the holiday season, or your conversions. A daily report for Black Friday or Cyber Monday, for example. It can be useful to save such days separately in a report and have them ready for the next year. Let's look at how you can do this in Google Analytics, Microsoft Clarity, and other ways.
What kind of data should your report contain?
Of course, it depends on what and how you report, but it's often advisable to have a specific fixed set of data that you include in the reports. That way, the data stays the same year after year, and you can quickly spot the differences. Without having to change your entire report right away. For yourwebsite hosting and business, determine which data points are important, such as the number of visitors, conversions that come from a traffic source, or the number of traffic from organic results. The list is endless, of course, and depends on the nature of your website and how you handle it.
An important number of measures is often what pages your visitors land on, how many there are, and where they come from. You can, of course, include advertising revenue or other income. And you can do a total cost of ownership calculation. For example, one data point that is important for my own informational websites is the number of articles published in a month. The more the better, of course. If you also write content for your site or have a team that does this for you. Then you can also track what is published per week or per month. This way you can easily see how and what is going live. And whether this is in line with your goal.
Daily and weekly reports
Daily reports can be easily created and automatically generated through Google Analytics. They can be sent directly to your email address or directly to the customer. With Microsoft Clarity, you will have to work with screenshots, but Microsoft is also working on allowing you to create reports.
Daily reports can be created for days when the number of visitors or conversions is particularly high. Of course, if you find that a particular day was particularly good or particularly bad, you can learn from that by examining that day in more detail. For example, with a report, you can quickly find out where the traffic was coming from. Whether it's an ad on Facebook or a post on a forum. It could also be that a page has risen in Google search results. For many reasons, a particular day can be a good day. You learn from the reports and may be able to compare them to next year or the week after that. To reiterate.
Monthly and annual reports
Monthly reports are interesting, of course, because most reports that come standard end up being per week or per month. Per month often gives you more data to work with, and you can better determine if a particular site did well. Or if it took more work to raise it. With the time frame of a month, it's also easier to determine if an investment has paid off. A week or a day, for example, is not long enough to see if an ad or link actually made an impact.
Annual reports are often interesting and give you the opportunity to take a step back and objectively see if your work has paid off. You may not have enough insight into these things during the year. The focus then tends to be on the day, week or month. Rather than looking at the entire calendar year. You can use Microsoft Clarity, Google Analytics, or an analytics program of your choice to create these reports. It's more than just entering the data into an Excel spreadsheet or whipping it up in a Word document or Google Doc for your clients. The raw data can then be put into a beautiful wrapper.