Also check out below articles
 12-06-2026
How do you optimize your website for Google Discover?
As a website owner you’re probably constantly focused on SEO: optimizing27-05-2026Is a "Coming Soon" page a good idea?
A common phenomenon in the world of websites and the internet is the “Coming13-05-2026The new Outlook shares your data
Outlook has been the go-to choice for many individuals and businesses—including04-01-2021Making an annual report of your website
It's the start of a new year again, with the new year come new opportunities. Also for your website and hosting. With an overall report of 2020 you can make sure you have a clear view on the priorities and you can refocus where necessary. Let's cover a few tips for the annual report you can make of your website!
Keeping track of some statistics is indispensable when gathering the data for an annual report. For this we are going to take into account that you have a number of tools installed on your website. The following tools can be used to keep track of the data and to look it up again at a later stage.
Tools for tracking website data
There are many roads that lead to Rome, also with website statistics tools. However, the most obvious one to use is Google Analytics. With its comprehensive reporting and extensive third-party support out there, it is by reason the most widely used tool for this. We also assume that you use Google Search Console to track results on the Google Search and Discover network. So you can keep track of how your website is performing. And incorporate this into the annual report.
However, feel free to use one of the popular other tools for this, as mentioned, there are multiple solutions for this that can be used.
Total number of users and page views for 2020
The total number of users is not only nice to know, but also gives you an idea of how your website performed in the last year. On an annual basis, you can then quickly see next year if you've already had more users. And how this was achieved with the other data you collect.
Total users can be understood in a few different ways, within Google Analytics you have three metrics that can be used for this.
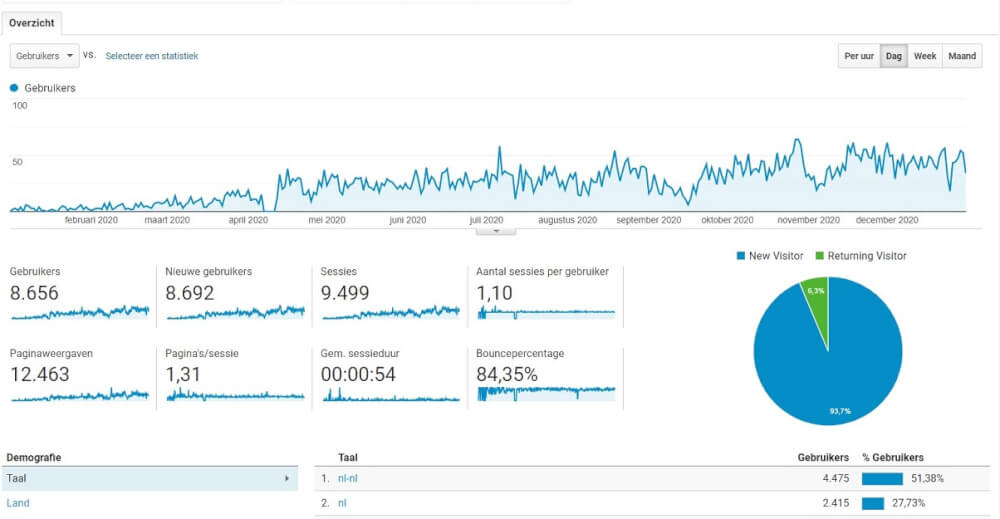
Namely total number of users, total number of page views and number of sessions. I don't consider the number of sessions to be entirely relevant to this report of your website. These are the people who returned or visited your website hosting multiple times. The total number of users and the total number of page views are important metrics to track. All these metrics you will see in the Target Group in Google Analytics, here you first select the full year. And after this you will see the report ready for you. See the cover photo of this article.
The report can then be created by the next step:

With a PDF file it is then easy to print out and to discuss at a meeting, or to share on the email. Here you can also combine multiple files into 1 to create a total report of the year and share it with colleagues or clients.
Most popular pages of your website
The most popular pages of a website are important to keep track of for a number of reasons. The biggest of these is that you can read from them where your success stories lie, and where else success needs to be spread. It is dangerous to rely on one search result that organically brings in the most traffic to your website. Especially on a yearly basis you can see right away which pages are most popular on your website. With each Google Core Update, it's exciting to see whether your organic traffic will be on the firing line or rewarded. So depending on 1 or a few articles or pages can often not be stable enough to rely on.
This can also be broken down further by tracking the source of the traffic. So a separate report can be generated for the organic results from Google, Bing or DuckDuckGo. And further splitting can be used to take direct traffic or referrer traffic from Social media for example separately.

The quickest way to see what the 2020 results are from your website hosting is to go to the Behavior category and then pull up the overview again. Here the correct date range should still be selected. In this overview you will then immediately see the information you are looking for. And a report can be made in the same way. With this yearly overview of your website you can immediately see which articles or pages are most responsible for the traffic. An important metric for any website regardless of purpose.
Google Search Console elaboration in the annual report
Google Search Console shows you many things about how your website is doing in Google's search results and Discover. Organic traffic, or what arrives at your website from natural search results, is an important metric for many. You don't have to pay for this traffic in a direct way, however, it does come with a load of work in most cases. And is thus an invaluable source of traffic to your website. Also because in most cases this can bring traffic on a very longer term than for example a post on Social Media or an advertisement.

Google Search Console can be accessed in the following way for the entire year 2020. Go to the Search Results and select the date range. After this you will see in the overview all the data. But also the most popular countries, the most popular pages and searches. You can also see the further position of those keywords and the impressions.
Are you ready with the 2020 annual report? Then take it with you with the first meeting of the year. And make sure that 2021 will be a better year for your website! And hopefully for other aspects as well.